
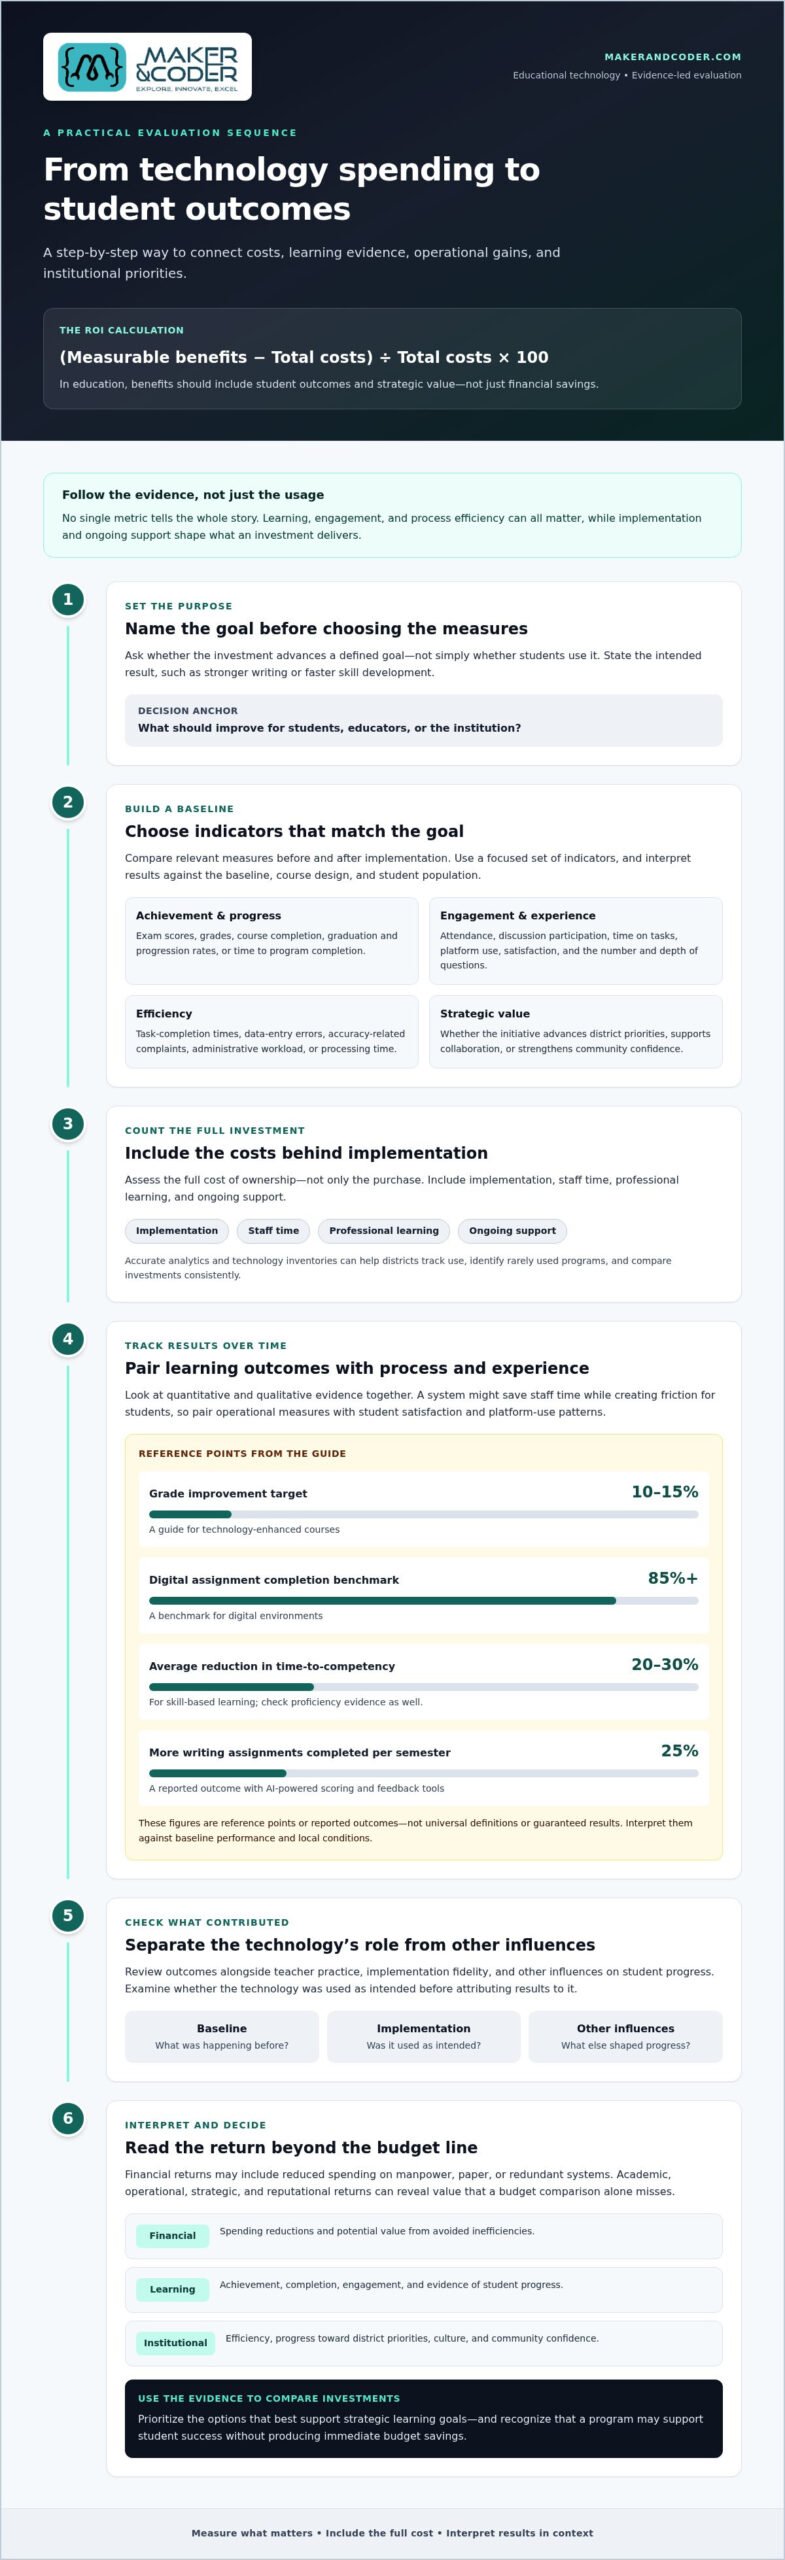
A technology investment can look successful on paper and still fall short for students. The basic rule for calculating ROI on educational technology is to subtract total costs from measurable benefits, divide the result by total costs, and multiply by 100. In education, those benefits should include student outcomes and strategic value, not just financial savings.
It’s reasonable to expect clear evidence before committing funding. Yet no single metric tells the whole story: learning, engagement, and process efficiency can all matter, while implementation and ongoing support shape what an investment delivers.
This guide explains how schools can connect technology spending with student outcomes, operational gains, and strategic goals. You’ll learn which costs and measures to consider, how to interpret results over time, and how to use the evidence to make informed funding decisions.
Key Takeaways
- Calculate ROI by comparing measurable benefits with the full cost of ownership, then connect the results to student learning and institutional priorities.
- Choose a focused set of indicators, such as achievement, engagement, completion, or operational efficiency, that reflect the goals of the initiative.
- Include implementation, staff time, professional learning, and ongoing support when assessing costs, alongside the potential value of avoided inefficiencies.
- Use a baseline and review outcomes over time to distinguish the technology’s contribution from other factors affecting student progress.
- Evaluate training and curriculum as part of the investment: effective support can help educators translate technology into meaningful learning experiences.
Linking spending to student outcomes and strategic goals
Calculating ROI on educational technology means connecting its costs with student outcomes and institutional priorities. A useful analysis asks whether the investment advances a defined goal, not simply whether students use it.
Connecting Investment to Student Outcomes
Connecting investment to student outcomes means assessing whether technology spending contributes to defined learning results. This matters because institutions can compare a program’s purpose with evidence from students’ grades, course completion, and engagement. Start by naming the intended outcome, such as stronger writing or faster skill development. Then compare relevant measures before and after implementation, while accounting for other influences on student progress.
Choose measures that fit the technology’s intended role. For technology-enhanced courses, a guide offers a 10-15% improvement in grades as a target, while 85% or higher is a benchmark for assignment completion in digital environments. These figures are reference points, not universal definitions of success. An institution should interpret them against its baseline, course design, and student population.
Achievement analysis can include exam scores, average graduating GPAs, course completion, and time to program completion. Graduation and progression rates add a broader view, especially in multi-level programs where students advance through several stages. For skill-based learning, the guide cites a 20-30% average reduction in time-to-competency. Compare that measure with proficiency evidence, so faster completion still reflects learning.
Engagement measures show how students experience learning activities. Track online-class attendance, discussion participation, time spent on tasks, platform use, and self-reported satisfaction. To assess communication, consider both the number and depth of students’ questions. Placement measures can extend the analysis beyond graduation by tracking graduates entering relevant fields or institutions. Interpret placement in light of program goals and student preparation.
Efficiency and Student Experience Measures
Efficiency and student-experience measures show how technology affects processes and learning conditions. A system might save staff time while creating friction for students. Compare task-completion times, data-entry errors, and accuracy-related complaints before and after implementation. Pair these operational measures with student satisfaction and platform-use patterns to see whether process gains accompany a better learning experience.
Connect each measure to a strategic decision. If a platform aims to improve feedback, assess assignment completion and student writing progress; the guide reports 25% more writing assignments completed per semester with AI-powered scoring and feedback tools. Treat that figure as a specific reported outcome, not a guaranteed result for every setting. Review the analysis against baseline performance, implementation conditions, and the institution’s stated learning goals.
How do districts use Return on Instruction to demonstrate good stewardship of K-12 education funding initiatives?
Yes. U.S. grants and funding rules affect net costs through eligibility, allowable uses, and reporting terms; tax treatment matters where applicable. Pandemic relief funds for K-12 districts were expected to end in 2024, making funding timelines part of investment planning.
Financial and Nonfinancial Returns
Return on Instruction is a results-based process for measuring technology’s effects on student learning, both quantitatively and qualitatively. Districts use it to show how an investment supports learning goals alongside responsible financial management. Financial returns may include reduced spending on manpower, paper, or redundant systems; academic returns may include stronger achievement and completion. Operational, strategic, and reputational returns indicate whether an initiative improves efficiency, advances district priorities, or strengthens community confidence.
Consider a digital platform intended to streamline family communication. A district could measure processing time and staff workload, then pair those figures with family satisfaction and responsiveness. Cultural returns matter too: assess whether the technology supports innovative thinking, accountability, and collaboration among staff, faculty, and students. These measures can reveal value that a budget comparison alone misses.
Measuring Educational Technology ROI
Measuring educational technology ROI means linking an initiative’s costs and results to a defined goal, then assessing its contribution to district success. Start with a clear objective and choose measures that connect directly to it. Accurate analytics and technology inventories help districts track use, identify rarely used programs, and compare investments consistently.
Separate the product’s contribution from teacher practice and other influences on student progress. For example, compare learning outcomes alongside implementation fidelity, then examine whether the technology was used as intended. Operational measures may include administrative workload, processing time, and communication efficiency. Districts can compare products’ results to prioritize investments that best support strategic learning goals.
ROI Beyond Financial Returns
ROI beyond financial returns includes effects on student learning, institutional culture, and public reputation. A program may support student success without producing immediate budget savings. Track academic outcomes alongside staff and student satisfaction, collaboration, accountability, and responsiveness to student needs.
Reputation measures can include satisfaction surveys from students, parents, faculty, and administrators, plus media sentiment after implementation. Districts can also assess whether technology strengthens partnerships and collaboration. The guide, drawing on the Total Economic Impact framework developed by Forrester Research, states that well-implemented educational technology initiatives typically have EdTech ROI ratios between 2:1 and 4:1. Treat the ratio as one lens, then interpret it alongside local learning and operational evidence.
Funding Factors Affecting EdTech ROI
Funding conditions include the source of money, permitted uses, reporting requirements, and the period when funds are available. Map each condition to the initiative’s costs and timeline. This clarifies whether grant support changes the net investment, adds reporting work, or limits how funds can support implementation and ongoing use.
For example, a district considering grant-funded technology should align the proposed purchase with the grant’s purpose and track required outcomes. Tax treatment depends on the purchasing organization and applicable circumstances, so include it in the financial analysis where relevant. The funding source changes the investment model, not the need to show how the initiative serves students and district priorities.
Including costs, cost avoidance, and support in ROI calculations
Calculate total cost of ownership by adding product, implementation, professional learning, staff time and compensation, internet, and usage costs across the technology’s useful life. Compare that full investment with measurable benefits and avoided costs, such as duplicated work or unused programs.
Program Costs and Utilization
Program cost and utilization analysis compares the resources committed with how often and effectively students and staff use the technology. It matters because a budgeted program delivers little value if adoption is low or support demands are overlooked.
Connect invoices and internal labor records with usage data. Include purchase or licensing costs, onboarding, professional learning, staff compensation, connectivity, and ongoing administration. Track active use by course or program, then compare it with the intended users and learning activities; for instance, institutions tracking workplace compliance through WH eLearning can monitor completion rates alongside licensing fees. When a digital resource is rarely used, its cost per active learner rises, even if the original purchase fit the budget.
Include tuition when evaluating an educational technology degree or training program, rather than confusing that investment with a classroom product’s cost. These figures illustrate why program tuition and technology ownership costs should be analyzed separately.
Opportunity Costs of Inaction
Opportunity costs of inaction are the resources or outcomes an institution may lose by keeping an inefficient process or delaying a needed change. Consider them alongside purchase costs when evaluating a proposed investment.
Map the current process first. For example, report staff hours spent on manual data entry, repeated communications, or maintaining redundant systems. Then connect those burdens to missed capacity, delayed student support, lost funding opportunities, or reduced staff morale. A South Carolina district reallocated more than $100,000 after identifying 38 unused programs. That example shows how utilization reviews can reveal resources available for higher-priority needs.
Total Cost of Ownership Over Time
Total cost of ownership includes direct expenses and the staff support required throughout implementation and use. A purchase price alone cannot show the investment’s full demand on district resources.
Build a lifecycle view that follows the technology from rollout through continued use. Include staff training, setup and maintenance time, internet costs, usage, and the effort needed to support students. Record avoided costs separately so savings do not obscure ongoing expenses. For instance, reduced paper use may offset part of a program’s operating burden, while staff time remains a significant cost.
Compare projected needs with actual use and learning progress at regular review points. If adoption changes, update the analysis to reflect current support demands and student growth. Teacher Training Programs can be part of the implementation investment; evaluate whether educators can use the technology effectively and connect classroom practice with intended outcomes. A complete report helps decision-makers explain why funding should continue, change, or shift elsewhere.
How Are Institutions Engaging in ROI Practices?
Schools use ROI analysis to guide funding decisions, identify implementation challenges, and connect technology with intended results. Compare products using the same measures, cost categories, baseline, and review period.
Survey Findings on ROI Practices
A September 2025 survey of 124 higher education technology leaders shows a gap between valuing ROI and measuring it. In that survey, 71% rated ROI at least moderately important, while 8% said it was not at all important. Yet 54% said their institution either did not consider or measure ROI for new tools, or they did not know.
Those results make measurement practices a useful focus for institutional leaders. A separate finding from the same survey says 46% reported their institution considers or measures ROI. Together, the figures signal why decision-makers need shared definitions, clear data sources, and assigned responsibility for reporting results.
Reasons Institutions Measure EdTech ROI
Institutions measure EdTech ROI to understand whether an investment advances learning goals and supports responsible decisions. A focused analysis can uncover implementation challenges, underused resources, and opportunities to prioritize improvements.
Choose measures that connect directly to the initiative’s purpose. For example, track administrative workload for a process-efficiency goal or student satisfaction for an experience goal. Include qualitative benefits, such as feedback about collaboration or responsiveness, alongside measurable outcomes. Schools can code recurring themes in survey comments and compare them with usage and performance data for a fuller picture of value.
Baselines and ROI Dashboards
A baseline records relevant performance before deployment, while an ROI dashboard shows progress against those starting measures. Together, they help institutions distinguish change from existing trends and review results over time.
Collect at least two semesters of pre-implementation data on grades, completion rates, and engagement metrics. A dashboard can then display those measures beside adoption and implementation fidelity. The guide classifies fidelity as high at 80% to 100%, middle at 50% to 79%, and low at 0% to 49%. Review operational metrics weekly, learning outcomes monthly, comprehensive ROI quarterly, and strategic impact annually. These intervals connect timely adjustments with longer-term decisions.
Comparing ROI Across Products
Product comparisons are most useful when every option is assessed using the same framework. Standardize outcome measures, cost categories, student groups, and observation periods before comparing results.
For example, compare two learning platforms using the same course-completion measure, student-engagement indicators, and implementation-fidelity criteria. Include qualitative feedback and operational effects, rather than ranking products by financial figures alone. Record data sources and note contextual differences, such as the courses or student groups served. This makes comparisons more transparent and helps institutions prioritize products that advance strategic objectives.
Evaluating teacher training, curriculum, platforms, and support programs
Evaluate an edtech investment as a connected learning system, not as software alone. Training, curriculum, platform use, and ongoing support all shape whether academic goals translate into classroom practice.
Assessing Training and Curriculum
Evaluate teacher training and curriculum by how well educators can apply technology to intended learning activities. Access alone does not establish whether students benefit. Measure educator readiness, confidence using the tools, and alignment between lesson objectives and curriculum. For example, a digital science platform needs learning activities that let students apply concepts, not merely open content on a screen.
Include training in the evaluation from the outset. Track participation, then assess whether educators use relevant platform functions during instruction. Pair those observations with student work or assessments linked to the curriculum. If educators complete training but classroom practice remains unchanged, the gap may point to a need for coaching, clearer lesson design, or additional implementation support.
Evaluating Platforms and Support
Platform evaluation considers whether a system supports its intended academic purpose and fits institutional teaching practices. Support programs matter because unresolved technical or instructional barriers can limit adoption and obscure results.
Set measures for active use, task completion, student participation, and support requests. Interpret them together: rising usage alongside persistent unresolved issues may signal friction, not success. Record the type of support required and whether educators can complete core teaching tasks independently. This helps institutions distinguish platform performance from training or implementation challenges.
Higher Education ROI and the Kirkpatrick Model
Higher education institutions can evaluate ROI by connecting an edtech tool’s intended learning outcome with academic, operational, and strategic measures. In a September 2025 survey of 124 higher education technology leaders, 46% said their institution considers or measures ROI when evaluating or implementing new edtech tools.
Assessments after technology deployment can help institutions track evidence over time. At each interval, examine a different layer of evidence: educator response, learning gained, application in teaching practice, and broader program results. For example, positive training feedback at the first review should be followed by evidence of classroom application and student learning at later reviews.
Keep funding decisions connected to the evidence. Compare program costs and support needs with intended outcomes, then identify what should continue, change, or receive further evaluation. A curriculum integrated with a platform, for instance, can be assessed through lesson alignment, educator use, and student performance together, rather than logins alone.
Use this framework to evaluate how training, curriculum, platforms, and support work together. For guidance on aligning educator development with learning goals, explore STEM learning resources.
Maker & Coder: MC 4.0 Kit
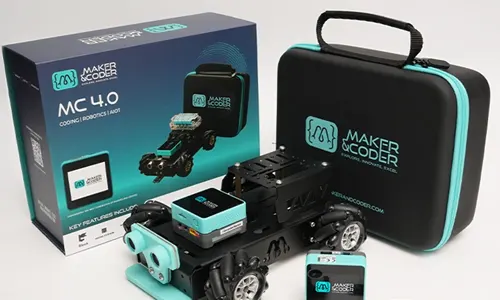
Maker & Coder’s MC 4.0 Kit gives educators a hands-on option to evaluate within a STEM learning initiative. Pair the technology with clear objectives, such as applying technical concepts through structured classroom activities, then assess student work and engagement against those goals.
The MC Curriculum (K-12) is designed to integrate with the hardware, while MC Blocks support modular technical learning. Teacher Training Programs can help educators build the skills to use these resources in instruction. Consider this ecosystem when your ROI analysis points toward practical STEM learning, aligned curriculum, and educator development as priorities. Track how implementation supports your chosen outcomes, and use that evidence to guide future funding decisions.
Contact Maker & Coder to discuss how its educational resources can support your learning goals.
Turn evidence into your next learning opportunity
Make each evaluation useful beyond a funding decision. Treat calculating ROI on educational technology as an ongoing way to refine learning: identify what students and educators need next, then use the evidence to shape the next initiative. Results can inform a new question, a revised classroom approach, or a stronger connection between curriculum and hands-on exploration.
For institutions developing practical STEM learning, Maker & Coder’s MC 4.0 Kit, MC Curriculum (K-12), and MC Blocks offer resources to consider within that planning process. The right starting point is the educational goal you want learners to reach and the evidence you’ll use to understand progress. Clear priorities make it easier to move from analysis to purposeful action.
Contact Maker & Coder to discuss your educational goals, and take the next step toward learning experiences built with intention.
Maker & Coder for Educational Technology ROI
Maker & Coder provides a STEM education ecosystem centered on the MC 4.0 hardware platform and modular MC Blocks. Consider it when your ROI assessment calls for a closer look at how hands-on technical learning fits your educational goals.
The MC4.0 Controller and Base, AIoT, and STEAM kits support technical learning, while the K-12 MC Curriculum aligns with the hardware to provide a structured educational pathway.
Frequently Asked Questions
Why Measure EdTech ROI?
Measure EdTech ROI to decide whether a tool advances its intended educational purpose and warrants continued resources. A district might find that a platform is popular but does not improve assignment completion or reduce administrative effort. That distinction helps leaders decide whether to adjust implementation, expand a successful use, or redirect funding. Include learning and operational evidence so the decision reflects student and staff experience, not adoption data alone.
Why is tracking K-12 ROI more critical now than ever?
Tracking K-12 ROI helps districts make funding choices based on documented educational value rather than habit. Pandemic relief funds for K-12 districts were expected to end in 2024, making long-term planning and careful resource allocation especially relevant. For example, a district can compare a program’s continued support needs with student progress and actual usage. That evidence helps leaders explain priorities and identify initiatives that no longer serve their goals.
How is ROI calculated for educational technology?
A practical approach to calculating ROI on educational technology subtracts total costs from measurable benefits, divides the result by total costs, and multiplies by 100. If a program saves staff time, quantify the hours and assign a consistent value to that capacity before comparing it with spending. Keep nonfinancial learning outcomes visible alongside the percentage. A positive financial result alone doesn’t establish that students learned more or that the investment met its educational purpose.
What costs should be included when calculating edtech ROI?
Include acquisition or licensing, setup, professional learning, staff time and compensation, internet, usage, and ongoing support. Also account for time spent integrating the tool into lessons, resolving access problems, and maintaining related processes. For example, a platform may require educator training and additional administrative work beyond its initial purchase. Separating one-time rollout expenses from recurring costs helps decision-makers understand ongoing obligations and their effect on the initiative’s value.
How can schools measure learning outcomes and productivity gains from edtech?
Pair student measures with workflow measures that reflect the tool’s purpose. For a writing platform, examine assignment completion and writing quality; for an administrative system, compare task time and processing errors. Use consistent definitions before and after implementation, and review whether educators applied the tool as planned. Student feedback adds context: comments about clarity or access may explain changes in usage or performance.
What data and baseline metrics are needed to evaluate edtech ROI?
Gather pre-implementation data that matches the intended outcomes, such as grades, completion, attendance, discussion participation, task time, and satisfaction. Baseline data covering at least two semesters for grades, completion, and engagement can provide a useful comparison. Keep definitions and student groups consistent across reviews. Record implementation details, including which courses used the tool and how educators incorporated it, so changes can be interpreted in context.
What are typical costs and benefits of educational technology investments?
Costs commonly include the product, implementation, educator learning, staff time, connectivity, and ongoing support. Benefits depend on the goal: a program may improve course completion, help students build skills, streamline communication, or reduce repetitive administrative work. For each initiative, define which benefits count and how to observe them. Do not treat projected savings as realized gains; compare projections with recorded results and the effort needed to sustain the technology.
How does edtech ROI differ for K-12 schools and higher education?
K-12 evaluations often connect districtwide funding and classroom implementation with student progress, participation, and family experience. Higher education may also examine program completion time, graduating GPA, progression, and operational efficiency across departments. The measures should reflect each institution’s goals, rather than force both sectors into one scorecard. For example, a district assessing classroom technology may focus on learning activities, while a university evaluating a system may include administrative workload.